IELTS Line Graph Masterclass
Line graphs are the most common way to show changes over time. Master the vocabulary of increase, decrease, and fluctuations.
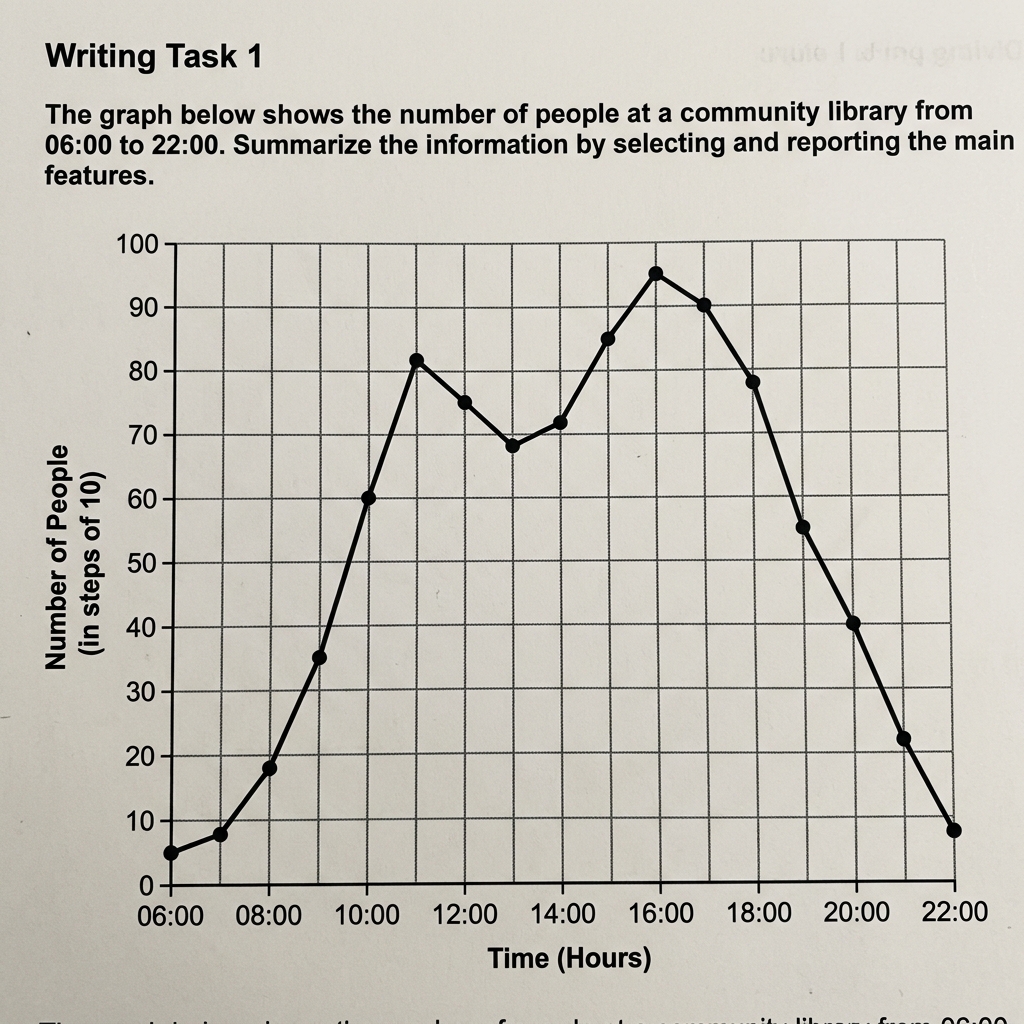
Task 1Line Graph
London Underground station hourly passenger numbers
The graph below shows the number of people using a London Underground station at various times on a given day....
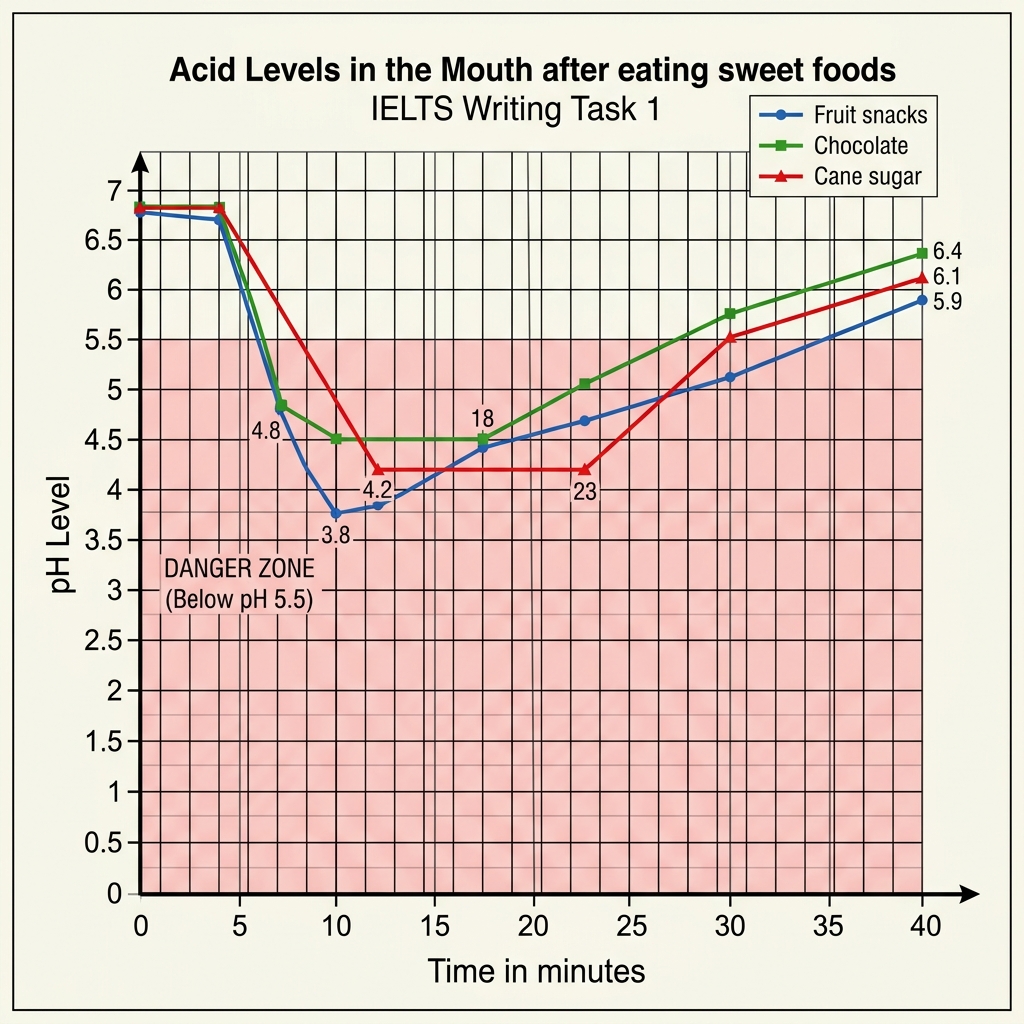
Task 1Line Graph
Sweet foods and acid levels in the mouth
The line graph below shows the acid levels in the mouth after eating sweet foods, which can cause tooth decay....