IELTS Bar Graph Masterclass
A bar chart is a graphical presentation of data that changes over time or compares categories. Learn how to describe trends and make comparisons like a Band 9 candidate.
Task 1Bar Graph
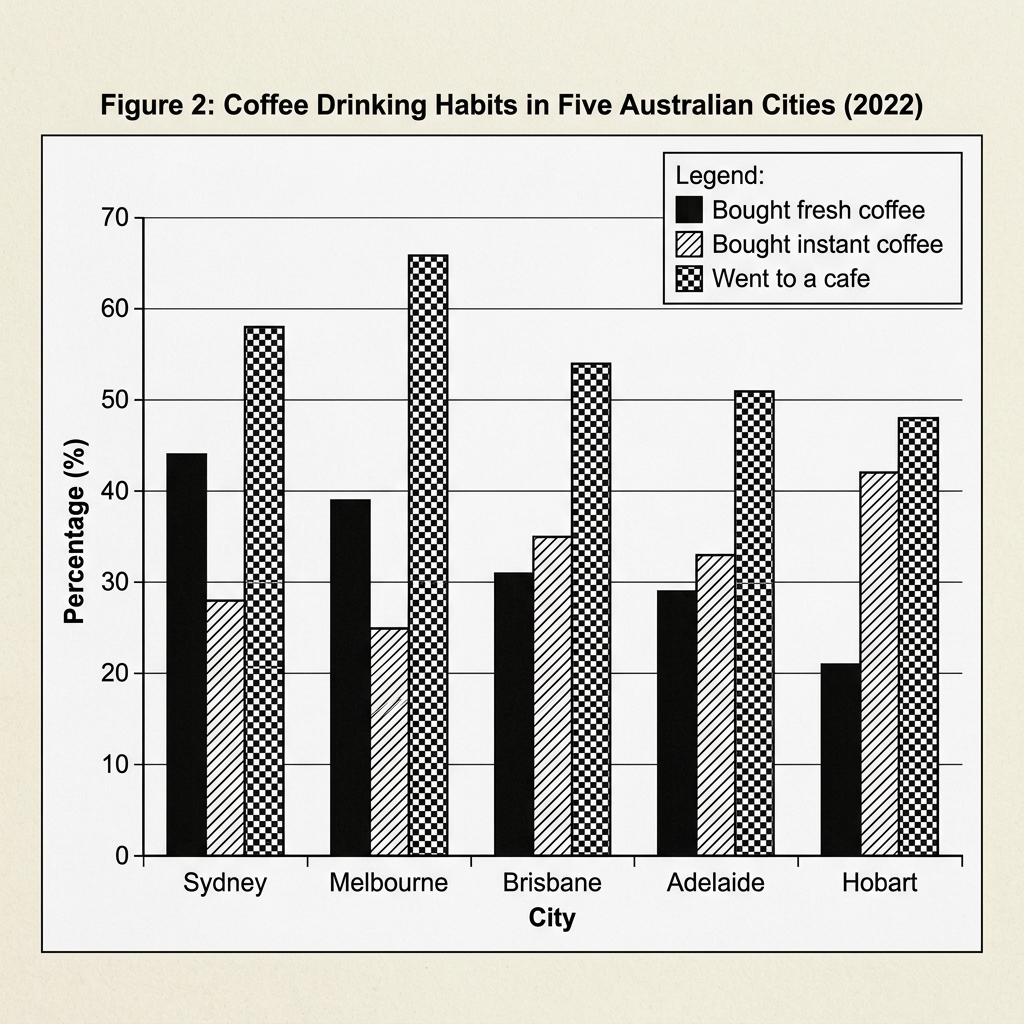
Coffee and Tea consumption in five Australian cities
The bar chart below shows the percentage of people in five Australian cities who purchased fresh coffee or tea...
Task 1Bar Graph
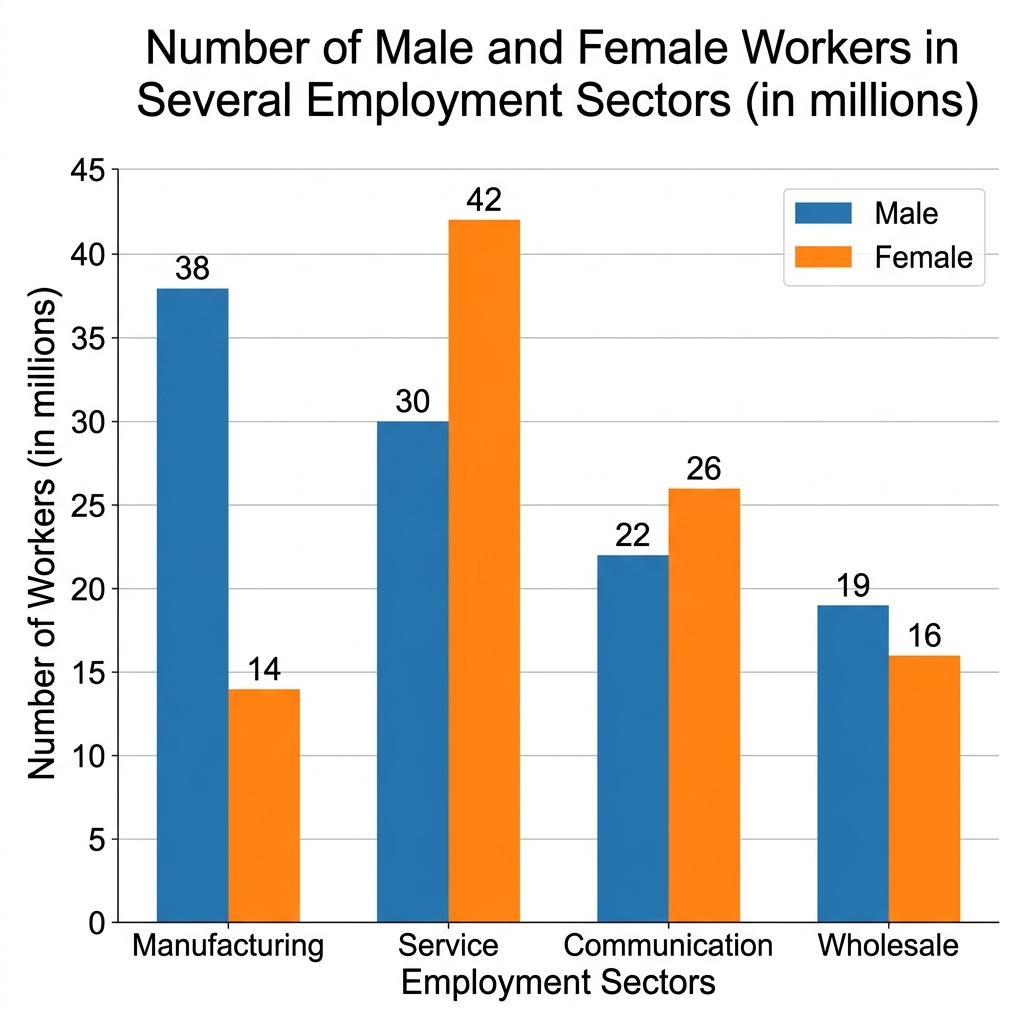
Male and female workers in several employment sectors
The bar chart below shows the number of male and female workers in 1975 and 1995 in several employment sectors...